


Most planning teams spend the first hour of every week assembling the same recap: pulling sales vs plan, calling out variance, slicing by category, flagging what to watch. The data is the same week over week. The format is the same. The work is mostly mechanical.
Claude can do almost all of it, including the dashboard, in about ten minutes. Here's the full workflow.
1. Decide What Your Recap Should Answer
Before you touch data, get clear on the questions. For most merchandise teams the recap covers sales vs plan and LY, margin dollars and rate vs plan, units, receipts, and a category or division cut. Write these down. They become the brief you'll hand Claude.
2. Pull Your Retail Data
Export the source files you'd normally pull: sales actuals, plan, LY, and a category or division breakout. Most planners can grab these from a BI tool, ERP, or planning system as CSV or Excel.
3. Clean and Structure the File
One file, clean columns, no merged cells, no totals rows. The structure that works best for Claude is one row per week-category combination, with separate columns for actuals, plan, and LY across the metrics you care about: sales, margin dollars, units, and receipts. Twelve rows for four weeks across three categories is plenty to drive a real recap.
We've put together a CSV template you can use as a starting point. It's pre-built with the column structure above and sample data for a four-week period. Drop in your own numbers and you're ready for step 4.
A few details that matter regardless of whether you use the template or build your own: keep dollar values as raw numbers, not formatted strings (Claude can read 2650000 but stumbles on "$2,650,000"). Use one row per week-category combination, don't pivot the data wide. And spell column names consistently. Claude will reuse them verbatim in the written analysis, so sales_actual reads cleaner in the recap than Wk Sls Act $.
4. Upload the File to Claude
Open a new chat and drag the CSV in. If your file is short, you can paste it directly into the message.
5. Give Claude the Business Context
This is where most recap attempts go wrong. Don't just say "summarize this." Give Claude the same context you'd give a new analyst on your team:
“This is the last four weeks of sales data by category. Compare actuals to plan and to LY. Variance-worthy is anything beyond +/- 3% to plan. Margin is reported in dollars; calculate rate as margin_actual / sales_actual. Receipts represent inbound inventory, flag anything that looks like over-buy risk if receipts are running ahead of plan, or under-receipt or late if they're running behind. Write a recap I can hand to my VP on Monday morning.”
6. Ask For the Written Analysis First
Before any visuals, get the words right. Ask for the headline number, the bigger story (often margin, not sales), driver call-outs by category, and a "watch this" flag for anything trending poorly. Read the output and correct framing now; it's easier than fixing it after a chart is built.
7. Ask Claude to Build the Dashboard
Once the analysis lands, ask Claude to render it visually:
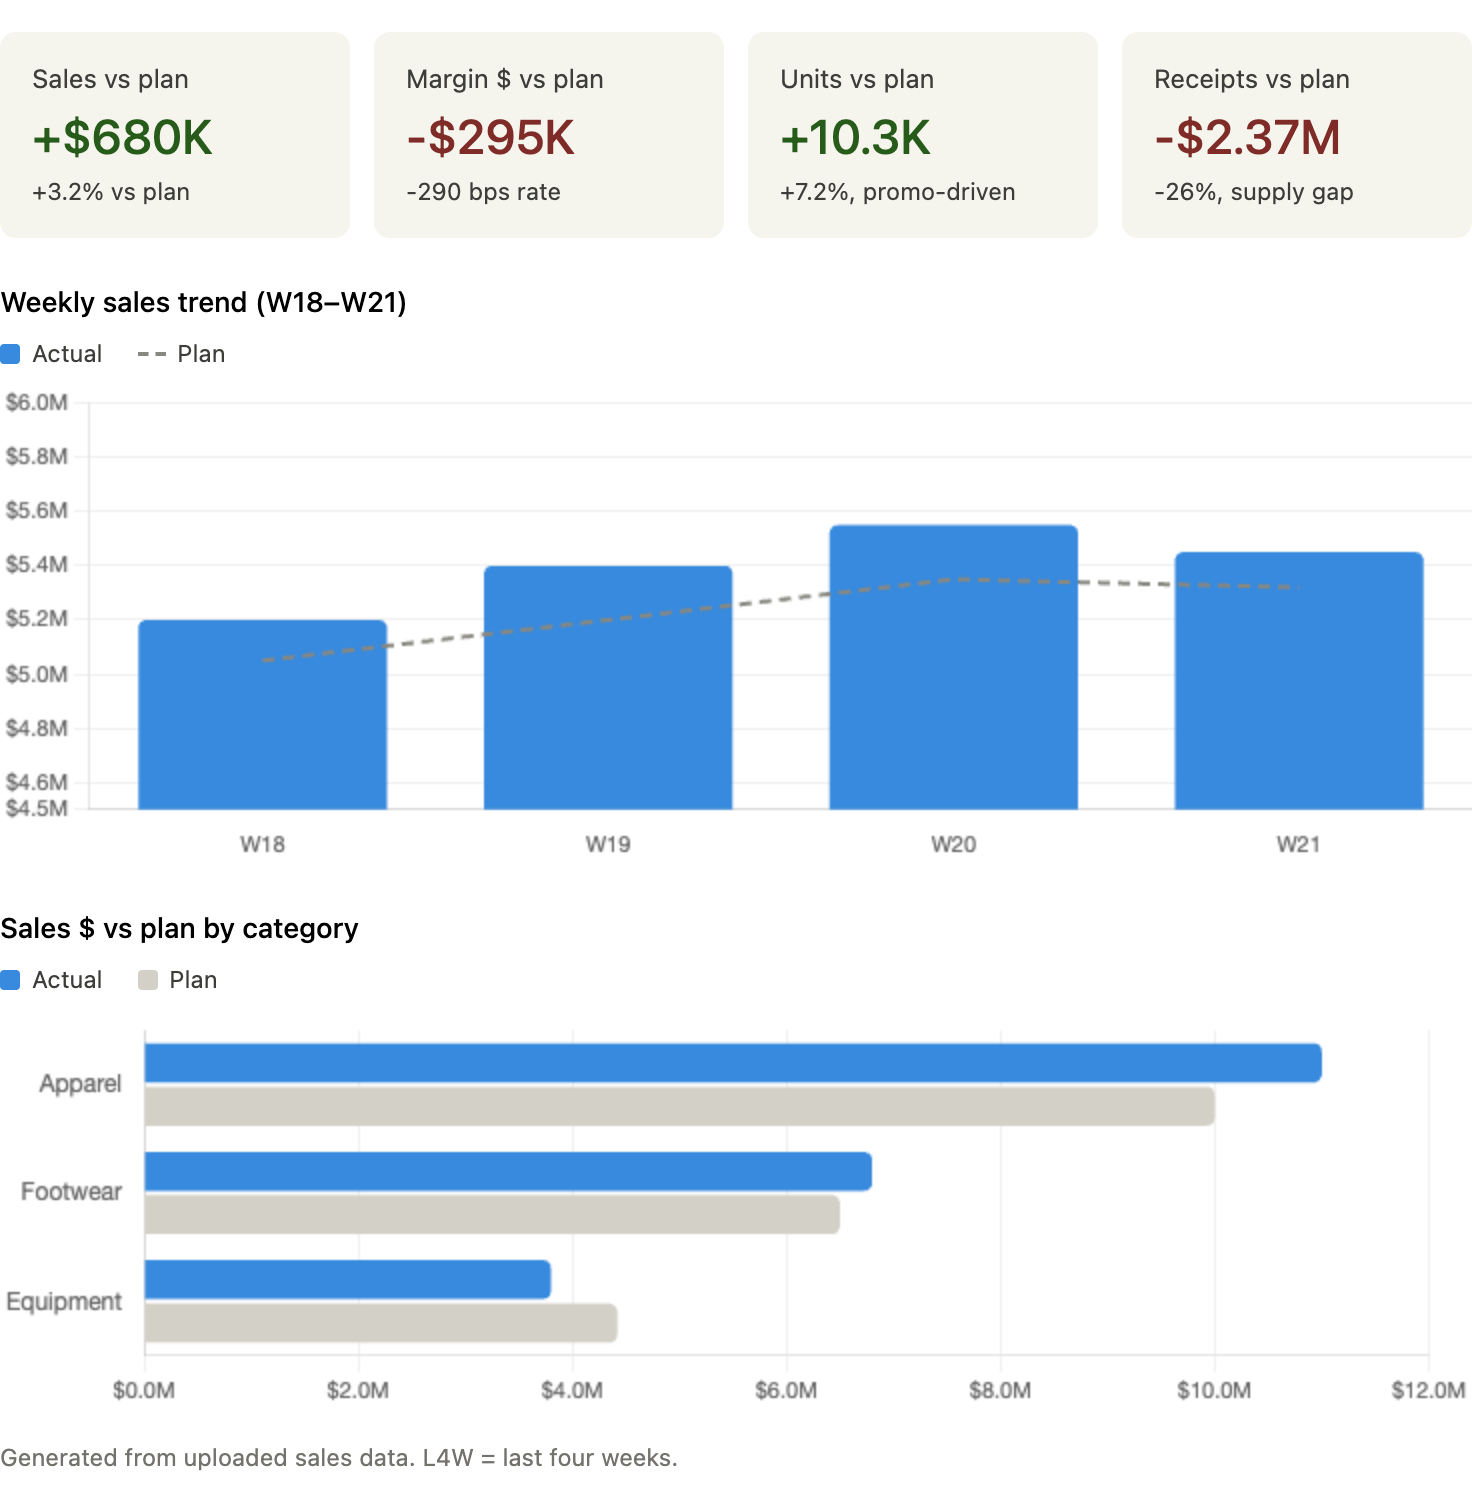
“Build a dashboard with KPI tiles for sales, margin, units, and receipts vs plan, a weekly sales trend chart, and a horizontal bar chart of sales vs plan by category.”
Claude will produce something like the dashboard below: KPI tiles, weekly trend, category cut.
8. Iterate
The first pass is rarely shippable. Common fixes:
- Claude flagged receipts running below plan as a positive variance.
- For inventory it's actually a supply-gap risk, the same way receipts above plan can be over-buy risk.
- Variance thresholds were too tight or too loose for your business.
- Color logic was wrong (negative variance shown as green).
Each correction makes the next week faster.
9. Save the Prompt as a Template
Strip out the week-specific bits and save the prompt structure. Next Monday: drop in the new CSV, rerun. The whole thing takes minutes once the template is dialed in.
10. Skip the Upload Step
If your planning data lives in Toolio, you can skip the export, clean, and upload steps entirely. Toolio's MCP Server lets Claude (and other AI clients) tap directly into your planning data, so you can run the recap right where you're already working, no uploads or files to manage.


