


Merchandise Planning
⏪ Last Last Week & Last Last Last Week
Two new time frames, Last Last Week (LLW) and Last Last Last Week (LLLW), are now in the Time Groups menu, so you can look at the week before last or the one before that.
Pin, unpin, and reorder them like any other time group, and stack them with LW and L4W for easy week-over-week comparisons in a single view.
📅 Month to Go time frame
There’s a new time frame called Month to Go (MTG) in the Time Groups menu that shows the remaining weeks of the current month, the flip side of Month to Date.
Pair it with MTD to see what’s already happened and what’s still to come in one view, and make mid-month course corrections with a clear view of the weeks still ahead.
Set BOP Targets directly in Merchandise Planning
You can now set a Beginning of Period (BOP) inventory target directly in the Merchandise Planning grid, giving you a way to anchor your plan to a specific inventory starting point and let Toolio reconcile the prior period automatically.
Click any BOP Target cell in the Inventory section to enter a value; clear it any time via the cell or right-click menu, and the prior period adjustment resets.
Rolling Inventory in Merchandise Planning
Merchandise Planning now supports Rolling Inventory, ensuring your beginning and ending inventory values stay accurate even when you’re viewing non-adjacent time periods. Enable it via a checkbox in the Scenarios dropdown.
Inventory chain calculations (BOP/EOP) now account for all periods in between, even those not visible on screen, so jumping from Q1 to Q3 still runs the chain through Q2.
Reach out to your CSM to enable for your workspace.
👉 Read more about rolling inventory
🔄 Item Planning Load Data Button
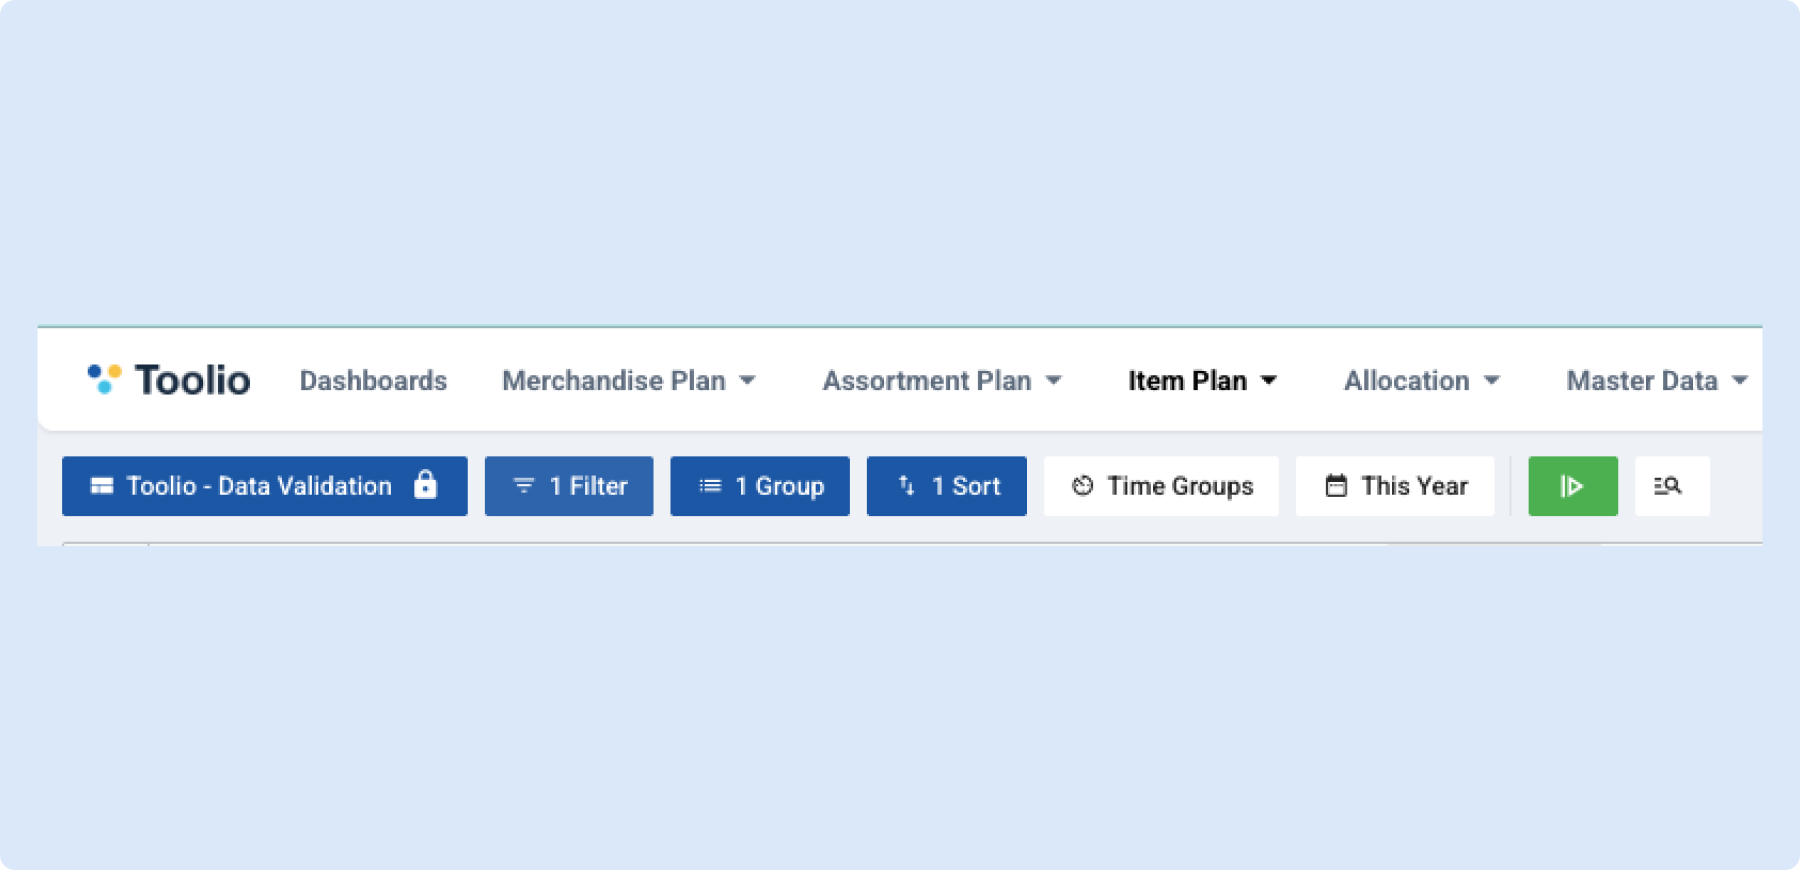
Item Planning now uses a “Load Data” button, just like Merchandise Planning, so you control exactly when data refreshes instead of the grid reloading every time you change a parameter.
Change your view, selectors, sort, filters, or grouping freely; the button turns green when there are pending changes, and clicking it fetches data with all your new selections at once.
You stay in control of when heavy data fetches happen.
Assortment Planning
🎨 Create Choices from PLM
You can now create new choices in your assortment plan directly from PLM styles in the Style Bank. A new checkbox column in the PLM tab lets you tick multiple rows (or select all from the header), then right-click and pick Create New Choice, each selected PLM style becomes a new choice in the current assortment plan.
The new choices inherit your filter overrides and use the date range you’ve set for choice creation, so you don’t have to re-enter anything.
Partial results are clearly flagged: you still get the choices that succeeded, along with a list of any that failed and why.
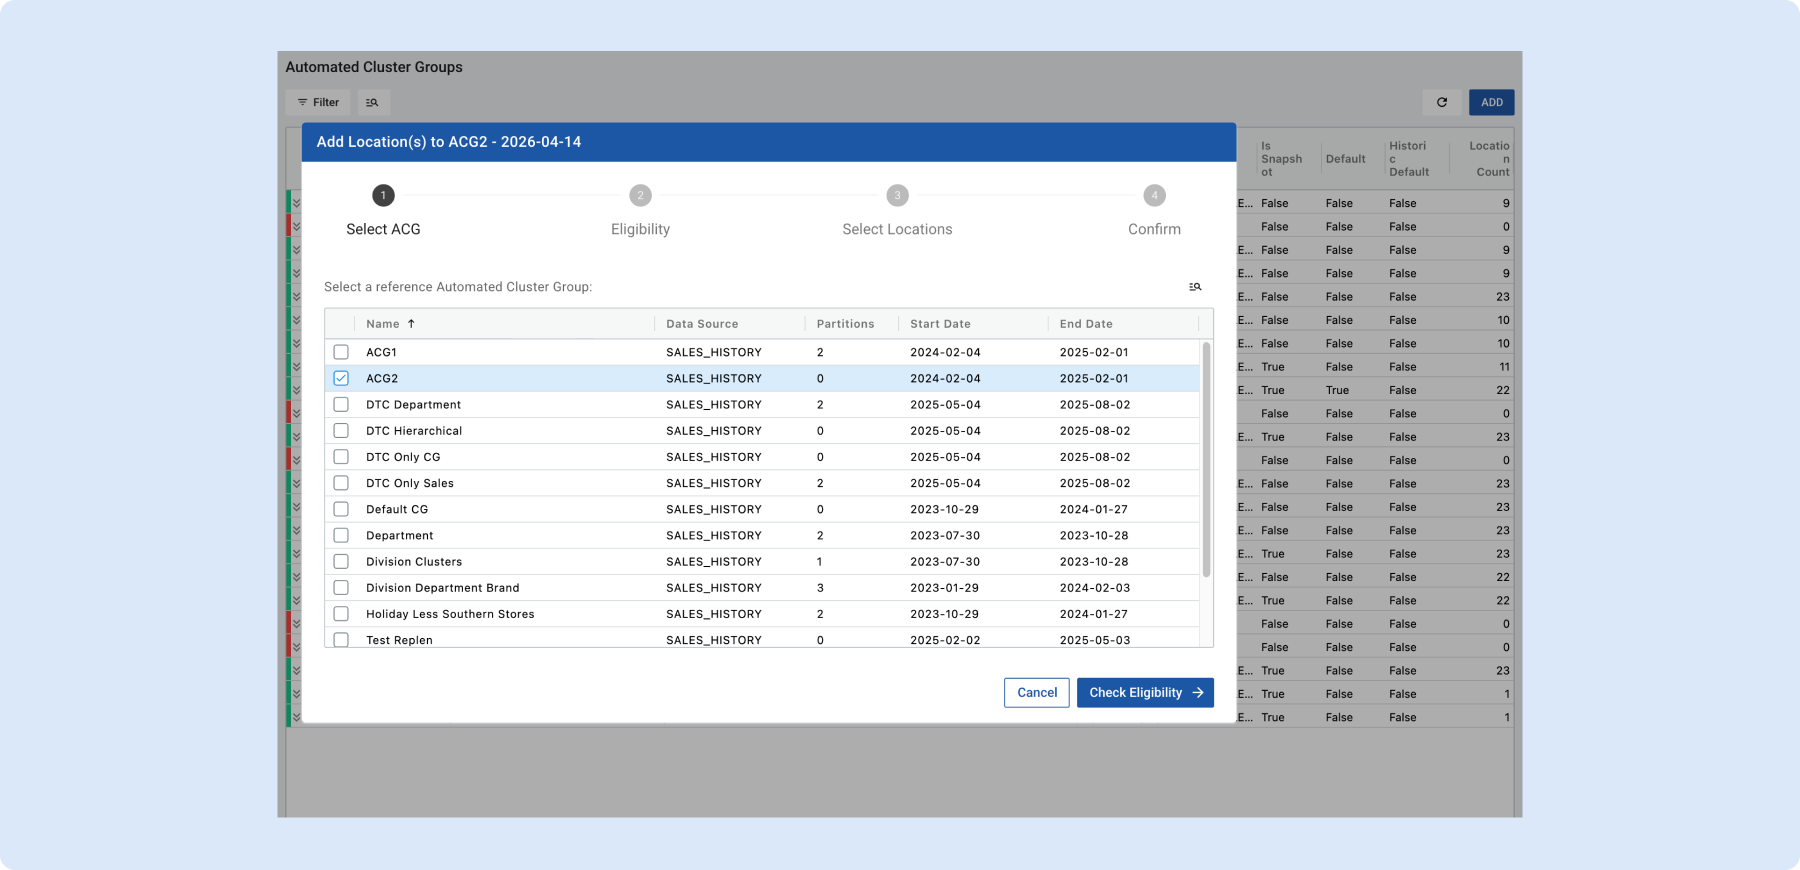
📍 Add Locations to ACG Snapshot
You can now add new locations directly to your ACG Snapshot, extending your ACG configuration without ever leaving the view. Right-click and select “Add Location(s) to this Snapshot,” choose a reference ACG (validated against its eligibility criteria), pick your locations, and review changes on an approval screen.
The forecast will run for affected choices during the next nightly scheduled job.
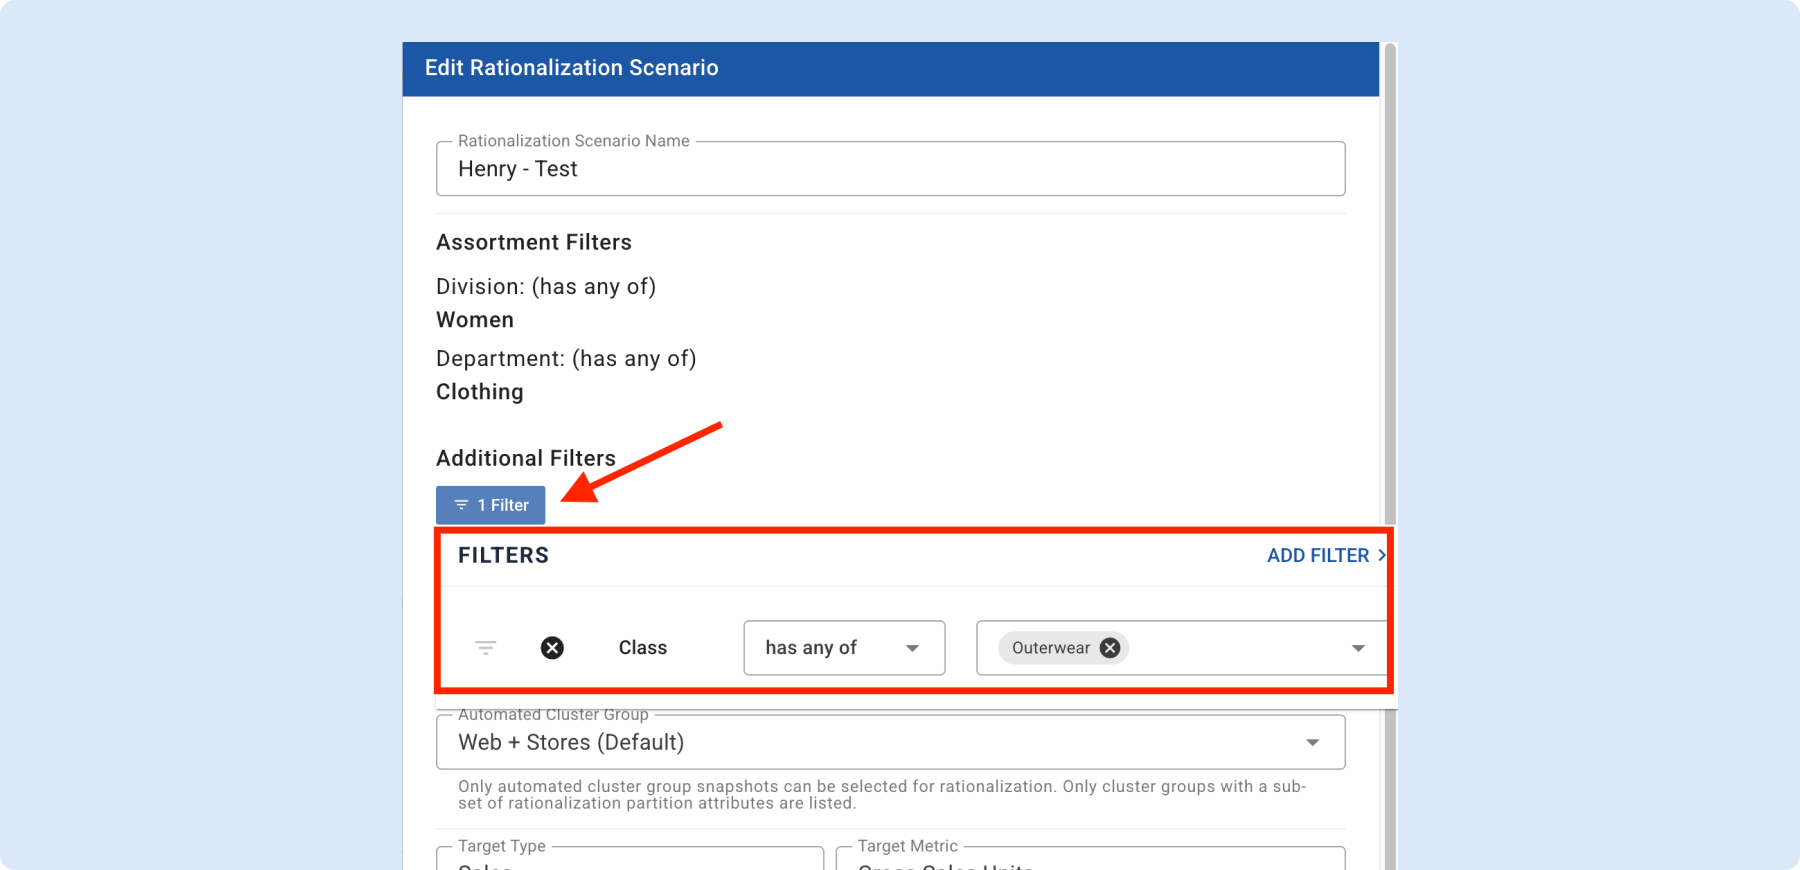
Improved Filtering for Rationalization Scenarios
Additional product filters are now available on top of existing Assortment filters, giving you more flexibility when defining your scenario scope.
If a rationalization scenario is created without a valid filter selected, the system now blocks the scenario and displays a clear warning, so your scenarios are always built on a well-defined product set, reducing errors and saving time downstream.
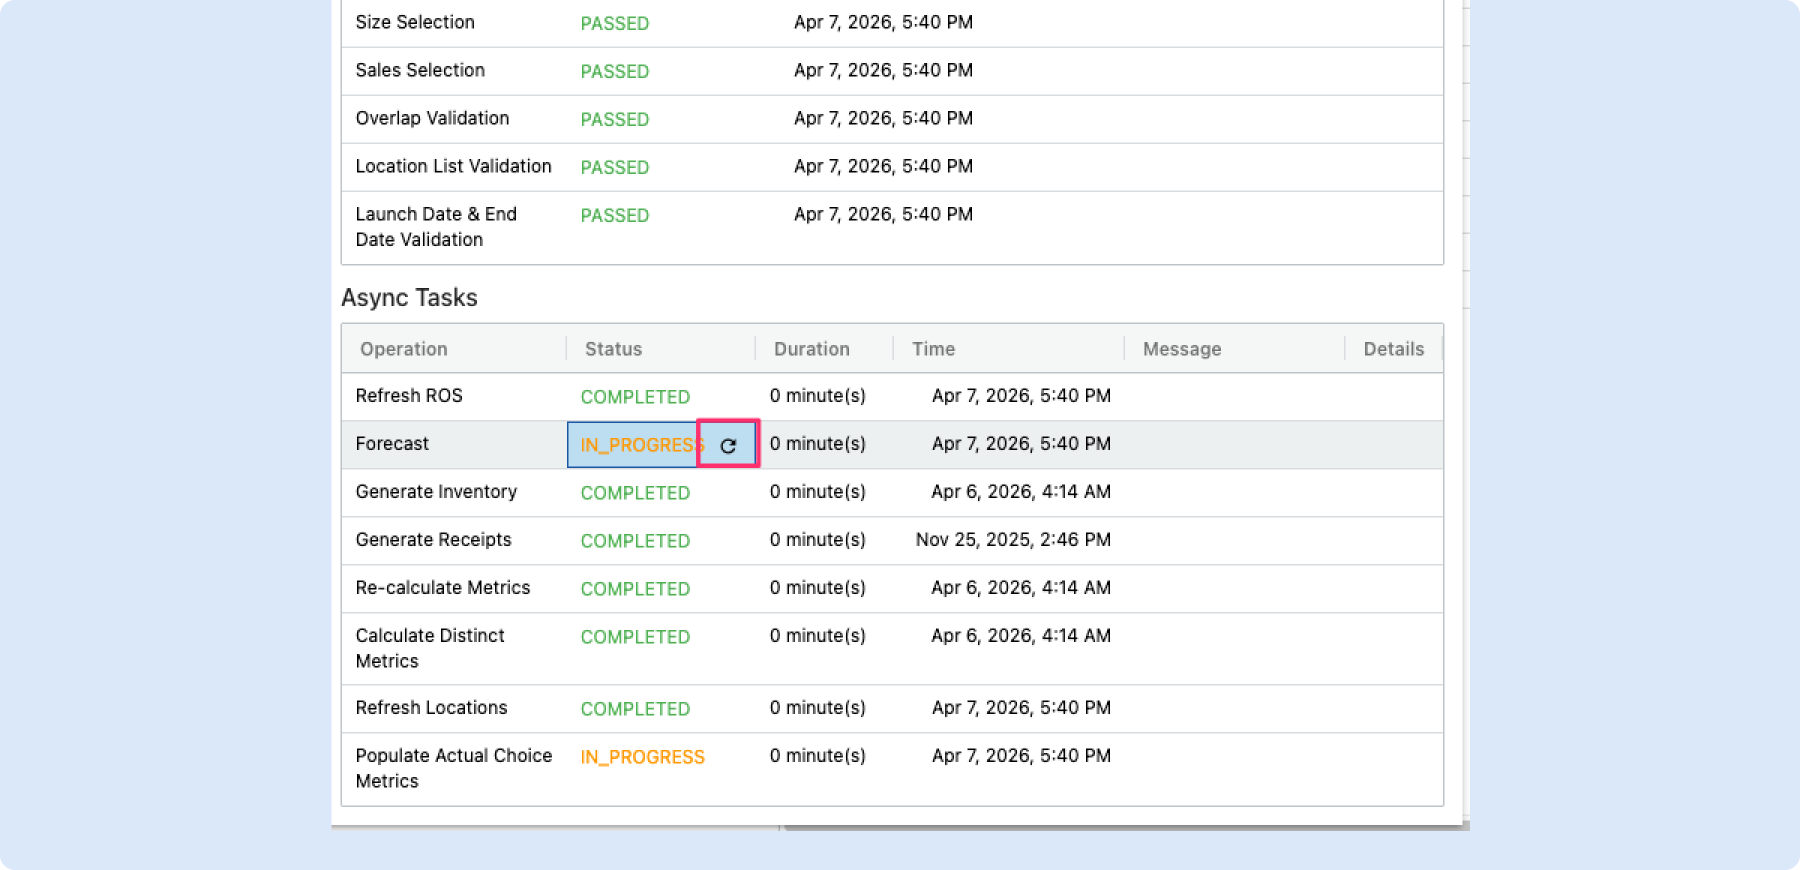
🔄 Re-Run Async Tasks from the Status Popup
You can now re-trigger any async task directly from the choice status popup, no need to go back to the right-click menu.
Hover over a status in the Async Tasks section to reveal a refresh button, then click to re-run that specific task (forecast, generate receipts, aggregate metrics, etc.) without closing the popup.
Saves clicks when retrying a failed or stale operation, and especially useful when reviewing multiple choices.
Dynamic Group Filters now available in Assortment Plan and Merchandise Plan
You can now filter by Dynamic Groups throughout Assortment Plan and Merchandise Plan, from creating a new assortment to reviewing your data across every major view.
Apply Dynamic Group filters in Line Planning, Metrics, Reporting, Hindsight, Style Bank, and ROS Model in AP, and in Seed and Reconcile in MP.
Open any filter panel and search by “Dynamic Group” to get started.
New Retrend Metrics & OOTB Views for In-Season Reforecasting
New OOTB views and supporting metrics enable in-season, exception-based reforecasting directly in line planning.
Two new AP views are designed to be used together: the Retrend Line List View (top) gives a high-level summary of retrend impact across your line, while the Sales Curve / Retrend View (bottom) is a weekly diagnostic of ACT performance vs. original plan, grouped by cluster.
New metrics includeRetrend Adjustment Rate and Gross Sales ACT vs. Original Plan. Recommended workflow: sort by Gross Sales Plan or Retrend Adjustment Rate, review exceptions, drill into the bottom view for weekly cluster performance, then take action, accept, partially accept, adjust inputs, or disable retrend. An updated Allocation view (Toolio – Retrend) mirrors the AP lower metric view for consistency across modules.
👉 View a quick Loom walk-through
👉 Read more about new retrend metrics
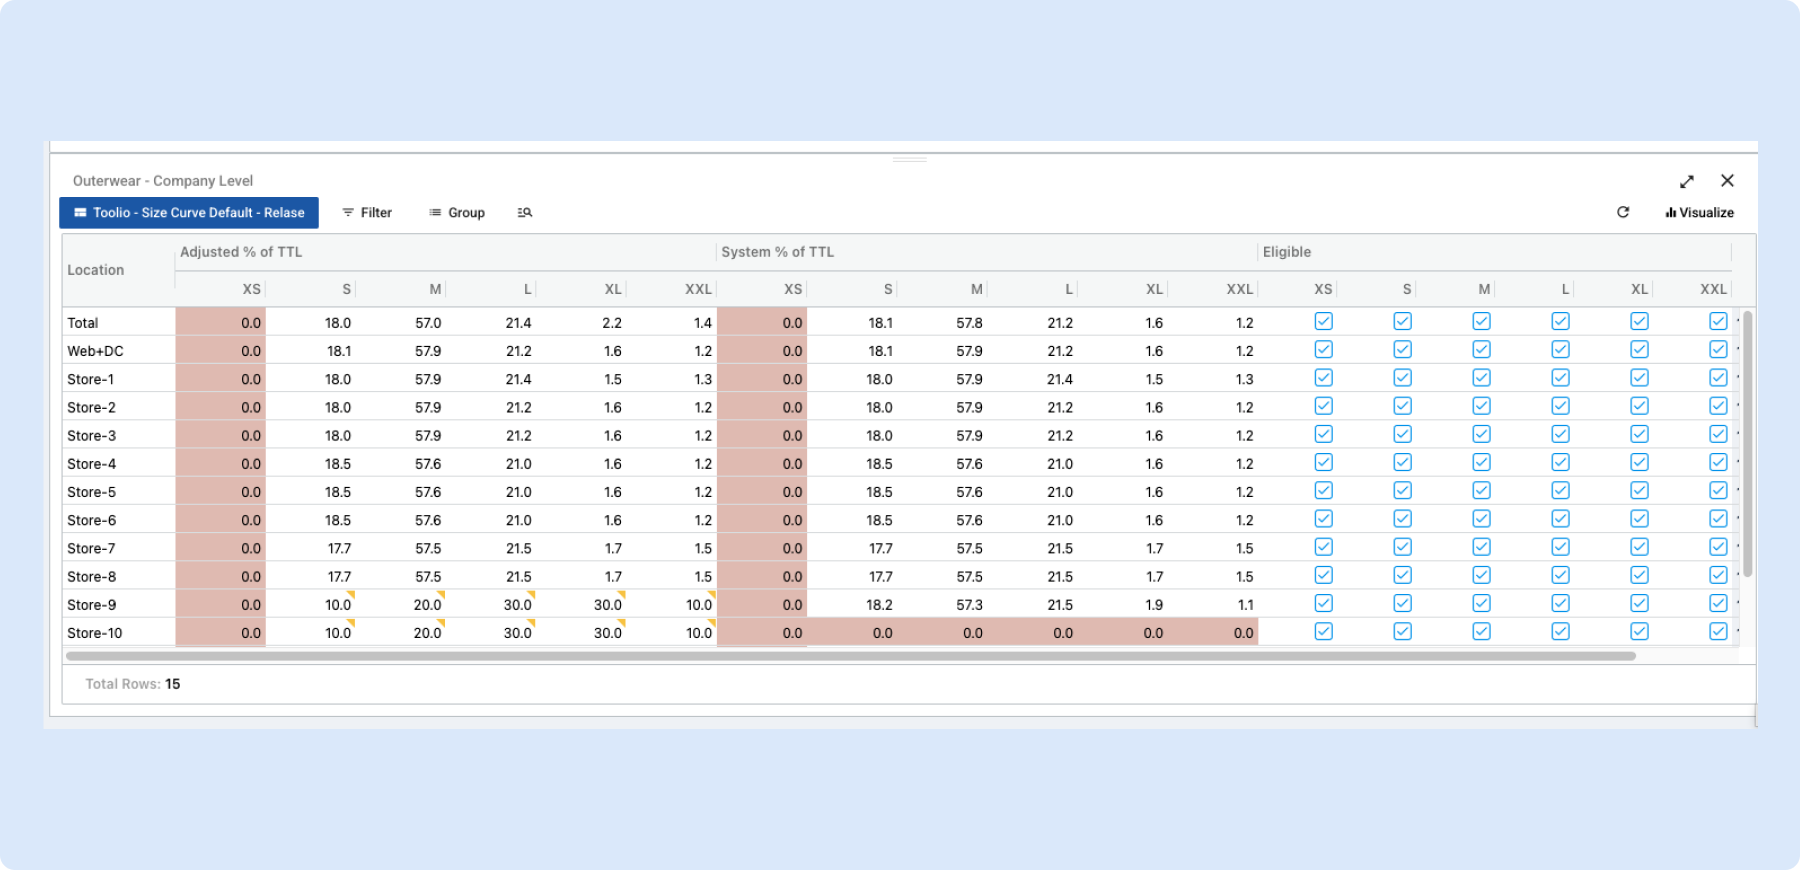
📐 Size Curve Spread, Views, Grouping & Conditional Formatting
The Size Curve Spread grid now has the same Views, Group By, and Conditional Formatting controls you’re used to in other grids, so you can customize what you see, how it’s organized, and which cells stand out.
Toggle column visibility and reorder Eligible, Adjusted % of TTL, and System % of TTL columns; switch between metric-first and size-first grouping; apply number-based conditional formatting to flag outliers; and save it all in a view.
Auto-size or size-to-fit controls let you fit columns to your screen or your data.
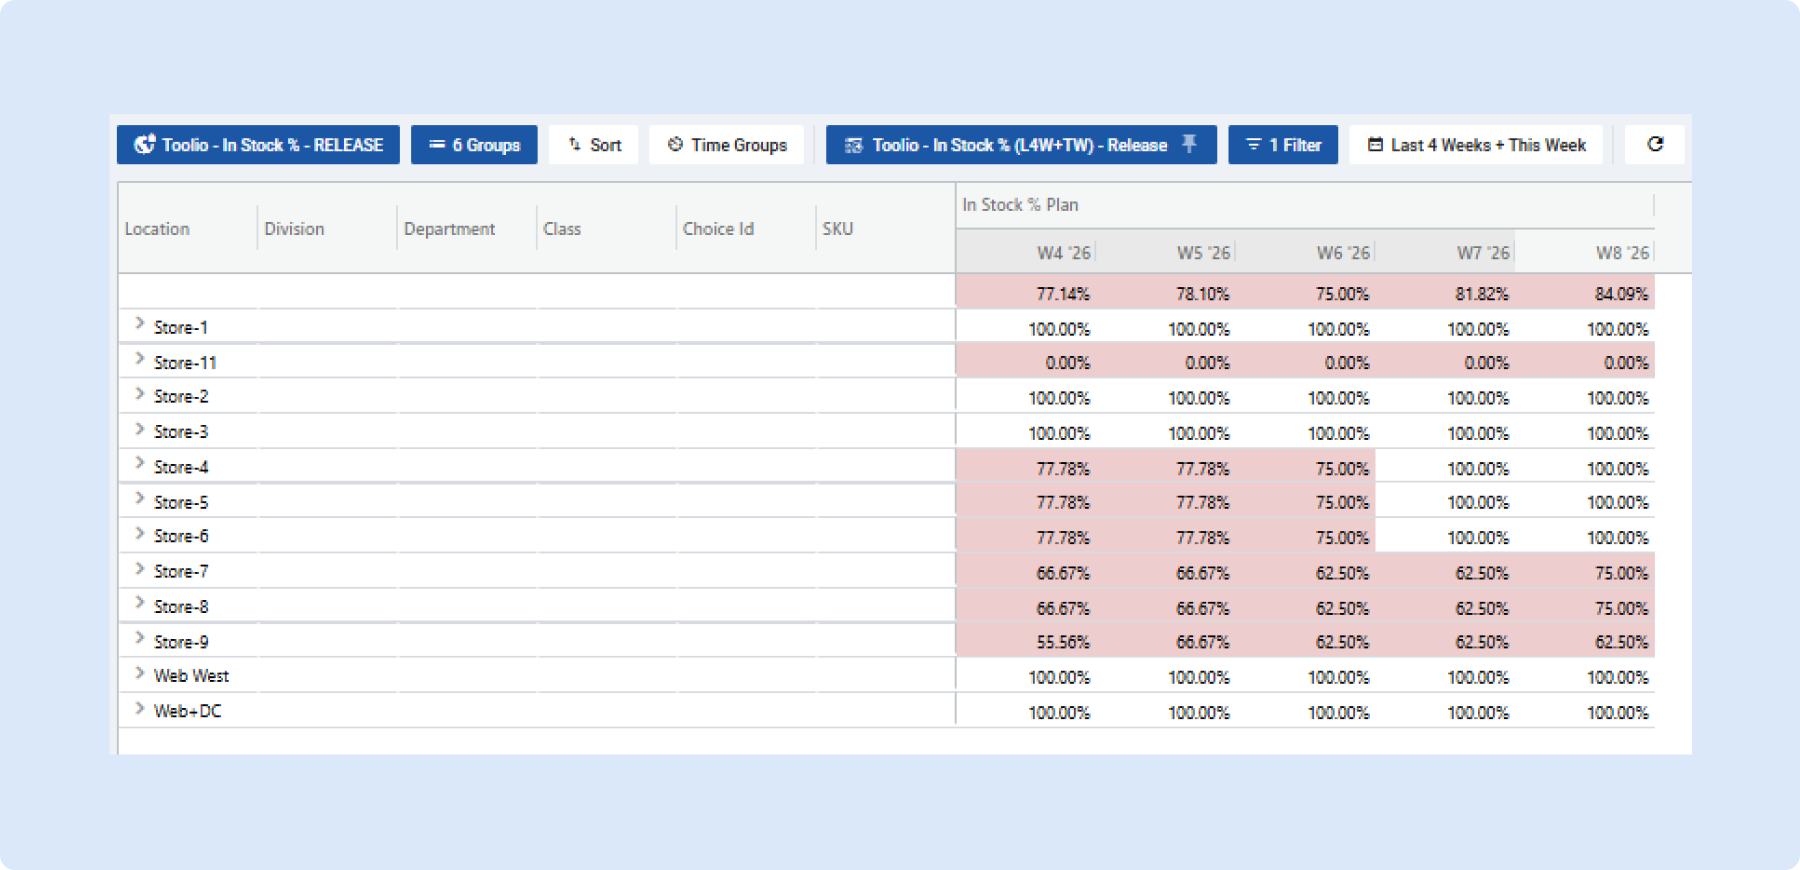
New Feature: Allocation In-Stock Percent View + Metrics Breakdown
A new In-Stock Percent OOTB view helps you understand how well your planned assortment is actually showing up in-store. It compares what should be in a location with what’s actually available at the start of each week.
New supporting metrics include Is Planned, In Stock, Planned and In Stock, and In-Stock Percent (Planned and In Stock ÷ Planned).
By default, the report shows the current week and previous 4 weeks. Best used with minimal filtering, date filters can impact historical accuracy by excluding items planned in earlier weeks.
Items that are in stock but not planned appear in the report but don’t impact in-stock percentage.
👉 Read more about in-stock percent view
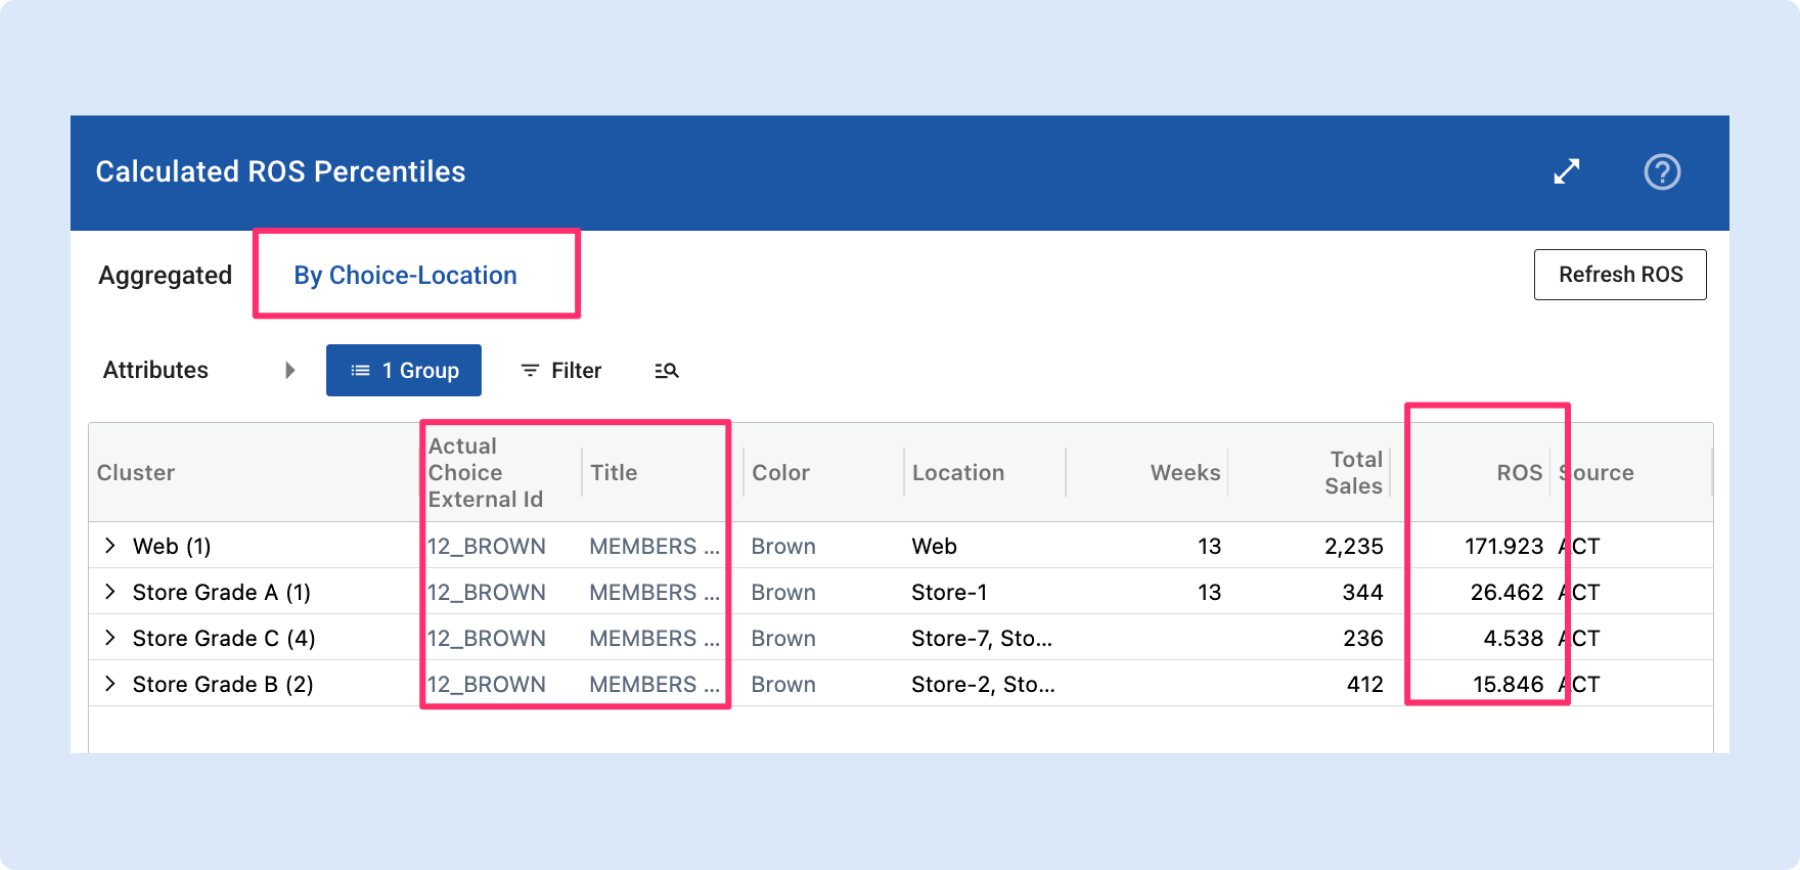
📈 ROS By Choice-Location View
The ROS percentiles dialog now includes a “By Choice-Location” tab that lets you drill one level deeper into Calculated ROS.
Double-click any Calculated ROS cell to open the dialog and see ROS, Weeks, and Good Weeks for each choice at each location or cluster.
Group and filter by cluster, source, location, or choice attributes, and pick which choice columns appear in the grid.
Useful for understanding which choices drive your Calculated ROS and for gauging the impact of data cleansing by comparing Gross Sales Units vs. Good Weeks Gross Sales Units.
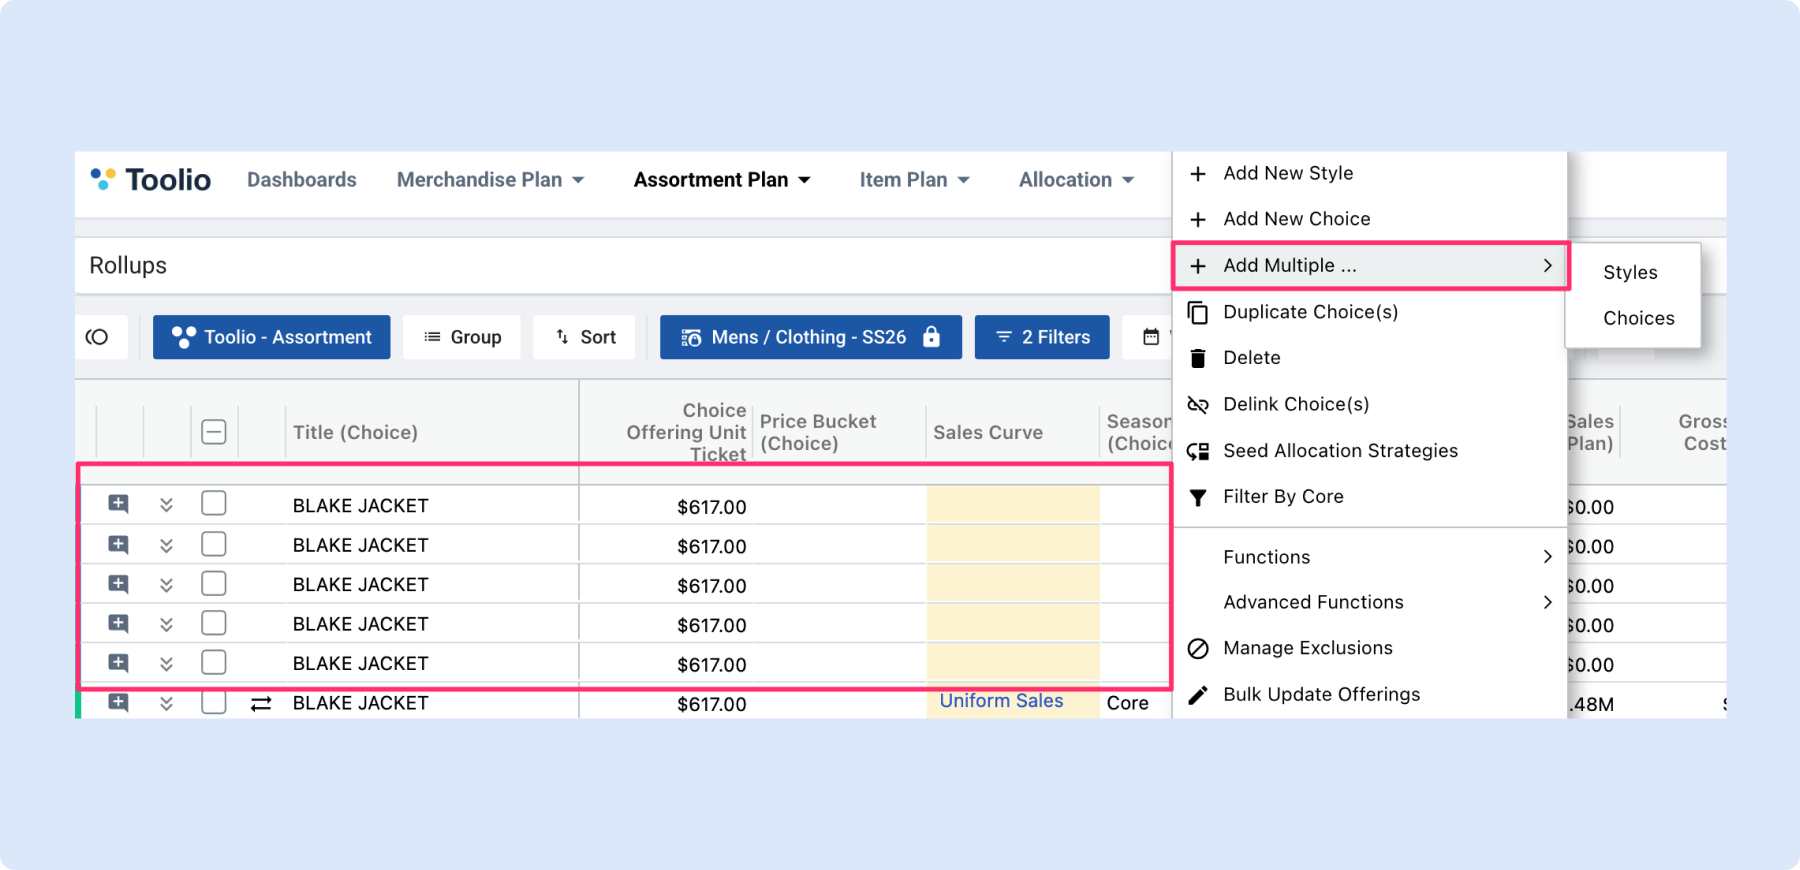
🧩 Bulk Add Styles & Choices
You can now add many styles or choices to your assortment plan at once instead of creating them one at a time.
Right-click in the assortment grid, select “Add Multiple… → Styles” (or Choices), enter the number you need, and they’re all created instantly.
The existing “Add New Style” and “Add New Choice” options remain for single adds.
Saves time when building out a new season or expanding an assortment.
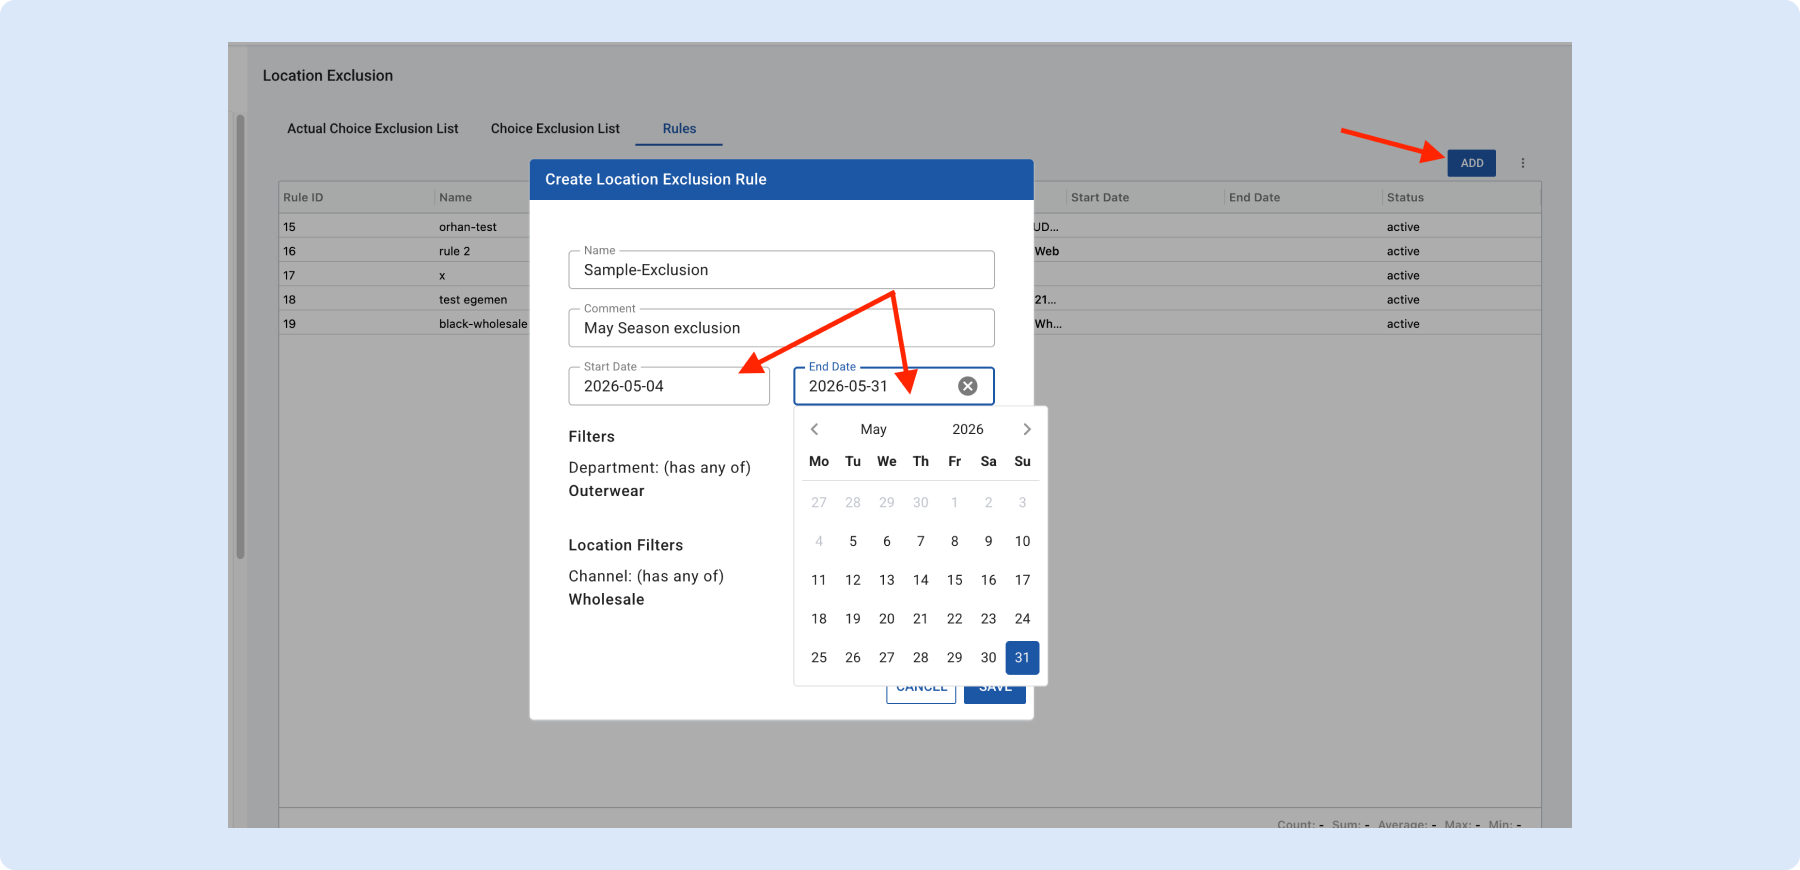
Time-Based Location Exclusions
Location Exclusion rules can now have start and end dates, giving you precise control over when exclusions apply.
Set active date ranges so rules automatically turn on/off based on your assortment lifecycle, see rule activity at a glance for a given offering (based on its launch date), and leave dates blank to keep rules always active, backward compatible with today’s behavior.
Import support for start and end dates to streamline bulk updates is coming later this week. No more seasonal cleanup or manual toggling.
📈 Net Sales Metric for Sales & Size Curves
You can now generate sales curves and size curves using net sales, which subtracts returns from gross sales, giving you a more accurate picture of true selling performance.
Choose Net Sales Units or Net Sales Retail when setting up a curve generator, and combine with Exclude Markdown Sales to strip out both returns and markdowns, isolating your full-price selling pattern.
Especially useful for categories with high return rates.
Rationalization & Hindsight Usability Improvements
Pagination is now available on the Rationalization and Hindsight tabs (page size 20), with a Load more CTA that retries failed page requests without requiring a full page refresh.
A status indicator now surfaces partition-level progress in Rationalization, if one partition fails, others still calculate and display.
The Calculate and Calculate All CTAs have been removed since they’re redundant with pagination.

Allocation
🏷️ Custom Attributes on Allocation Strategies
You can now use any custom attribute defined on a style or location to drive Allocation Strategy rules.
Before, strategies could only use a fixed set of defaults; now any attribute you’ve set up across styles or locations is available in strategy conditions. Build rules like “allocate to locations where Store Tier = A” or “prioritize styles with Launch Flag = true” without workarounds, your strategies can reflect the same segmentation logic you already use elsewhere.
🔄 Allocation Strategy Retrend Control
You can now disable re-trending on individual choices directly from the Allocation grid, so excluded choices stay out of the re-trend process without affecting the rest of the plan.
Right-click a choice to toggle Retrend off, and the system will skip it on the next run.
Useful when a choice has unusual sales patterns, is being phased out, or needs a manual forecast override while the broader assortment continues to re-trend normally.
Day in the Life, 7 New OOTB Views for Allocators
Seven new out-of-the-box views in Allocation give planners a guided “day in the life” workflow, from reviewing demand signals and prioritizing locations to checking exceptions and finalizing pushes.
Each view is pre-configured with the metrics, filters, and grouping that matter most for that step, so you can click through the workflow without building views from scratch.
Works for both new allocators getting up to speed and experienced planners who want a consistent daily routine.
👉 See the Allocator In-Season Views Overview in the Help Center
General Platform Updates
Customize PO Numbering Rules in Settings
You can now configure custom PO numbering rules directly in Toolio, choose a prefix, number padding, and starting value so generated PO numbers match your internal conventions.
Rules can be scoped by vendor, location, or brand, and the system enforces uniqueness across runs.
Replaces the previous flat sequential numbering, and makes it easier to reconcile Toolio POs with your ERP or vendor portals without manual renaming.
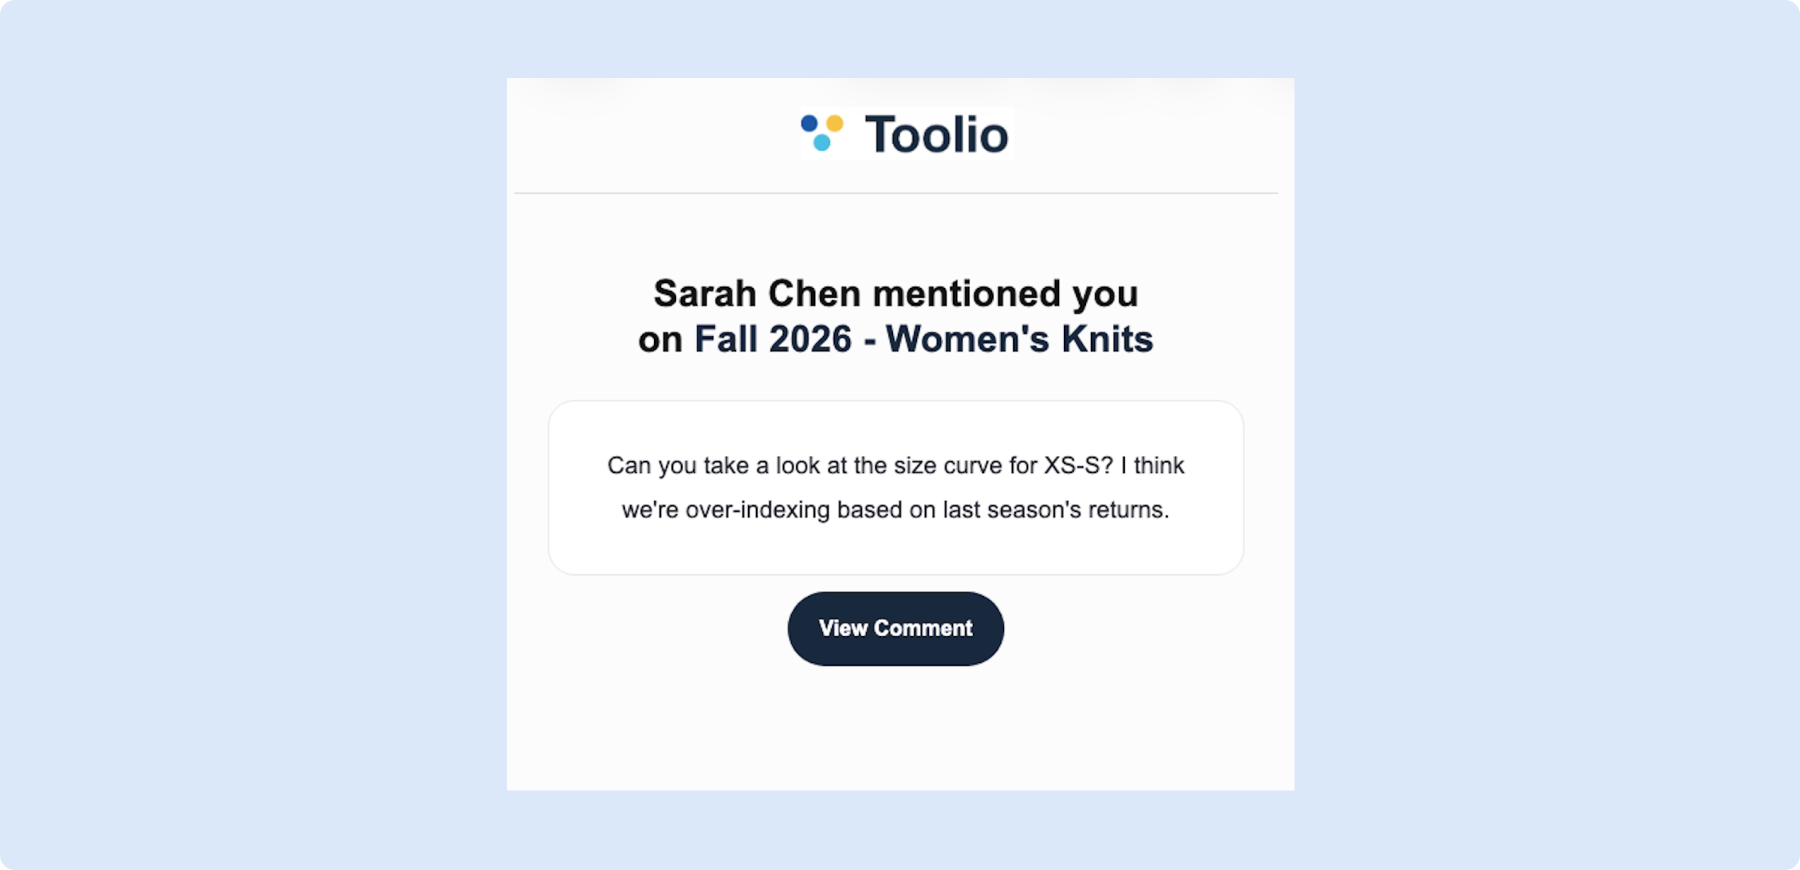
💬 Comment Mention Notifications
You now get an email whenever someone @mentions you in a Toolio comment, including a preview of the comment, the item or view it’s attached to, and a deep link back into the app.
Notifications are batched lightly to avoid spam, and you can manage frequency and channels from your user preferences.
Keeps cross-team conversations moving without requiring everyone to live in Toolio all day.
Need Help? We're Here for You!
Our support team is always ready to assist you. If you have any questions about these updates or need help getting started with new features, don’t hesitate to reach out!
Is there a feature you think would be a great addition? Let us know here!
